Douglas by the Numbers
The segregation of Chicago's neighborhoods combined with the isolation of the Black Belt, have shaped Douglas to be a neighborhood that continues much of the racial and economic demographic trends today, as it did in the past. To truly understand though, the present social and economic developments occurring in the community, it is crucial to examine the present statistics that exist within the community.
(All numbers are from 2013.)
Douglas Overall
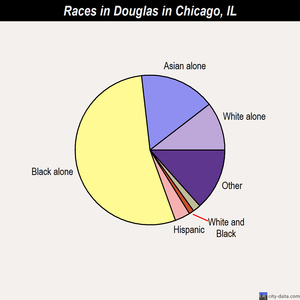
Racial Makeup
Black - 50%,
Asian - 20%,
White - 10%,
Hispanic - 2%,
Other - 15%,
Multiple Races - 2%
Racial Makeup
Black - 50%,
Asian - 20%,
White - 10%,
Hispanic - 2%,
Other - 15%,
Multiple Races - 2%
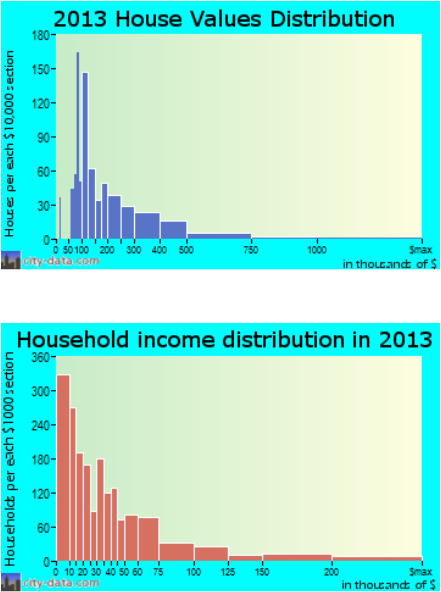
Estimated Median House Value
$267,628
Average household size
2.0 people
Estimated median household income
$32,620
Percentage of family households
29.5%
Estimated Median House Value
$267,628
Average household size
2.0 people
Estimated median household income
$32,620
Percentage of family households
29.5%
Percentage of residents with income below the poverty level
39.0%
$267,628
Average household size
2.0 people
Estimated median household income
$32,620
Percentage of family households
29.5%
Estimated Median House Value
$267,628
Average household size
2.0 people
Estimated median household income
$32,620
Percentage of family households
29.5%
Percentage of residents with income below the poverty level
39.0%
|
.
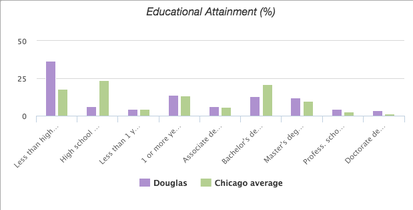
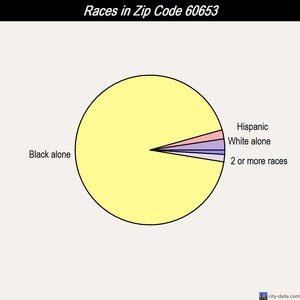
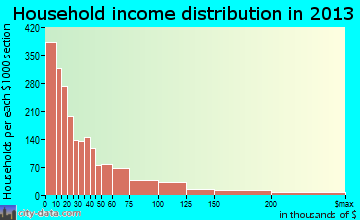
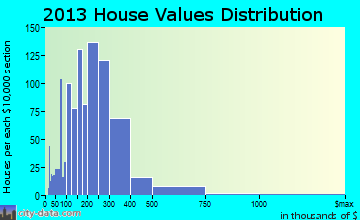
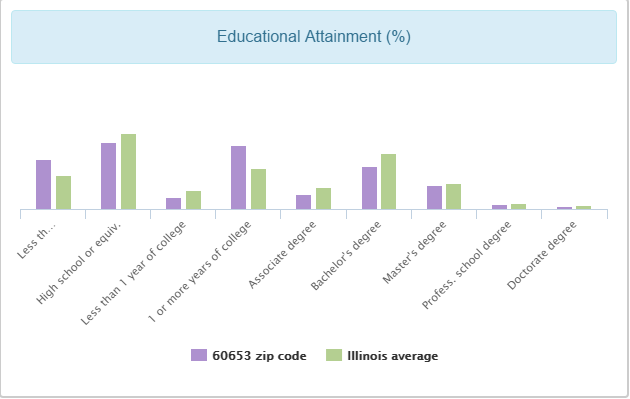
Percentage of residents who speak English at home 98% Percentage who are foreign-born 15.6% Percentage of residents who live in the same house five years ago 57.5% Two largest groups, in percentage, of educational attainment Less than High School -> 36.5%, 1 or more years of college -> 14% 60653 Racial Makeup Black - 80% Asian - 2% White - 5% Other - 1% Hispanic - 5% Multiple Races - 2% Estimated Median House Value $242,400 Average household size 2.2 people Estimated median household income $24,968 Percentage of family households 42.5% Percentage of residents with income below the poverty level 37.4% Percentage who are foreign-born 4.5% Percentage of residents who live in the same house five years ago 45% Two largest groups, in percentage, of educational attainment High school or higher -> 82.3%, Bachelor's degree or higher -> 26.5% |
|
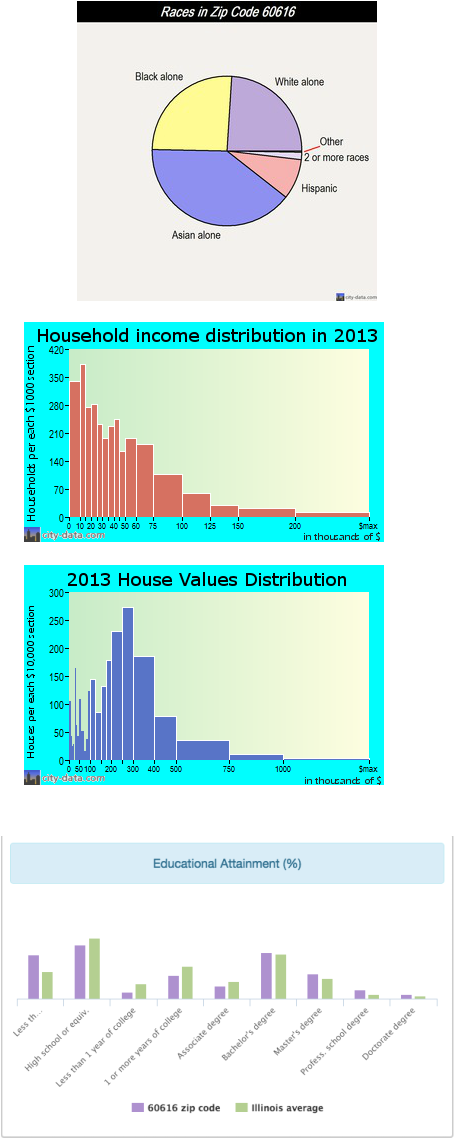
60616:
Racial Makeup
Black - 25%,
Asian - 40%,
White - 20%,
Other - 1%,
Hispanic - 10%,
Multiple Races: 5%
Estimated median house value
$288,100
Average household size
2.2 people
Estimated median household income
$44,258
Percentage of family households
38.8%
Percentage of residents with income below the poverty level
24.0%
Percentage of residents who speak English at home
51.6%
Percentage who are foreign-born
34.7%
Percentage of residents who live in the same house five years ago
59%
Two largest groups, in percentage, of educational attainment
High school or higher -> 80.4%, Bachelor's degree or higher -> 37.4%
|
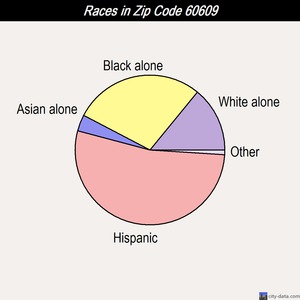
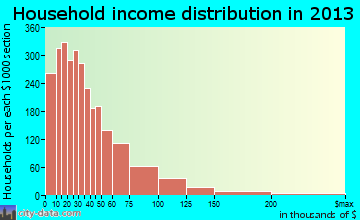
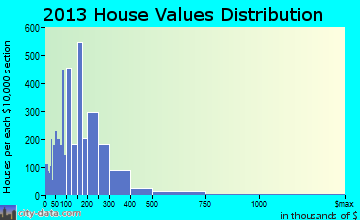
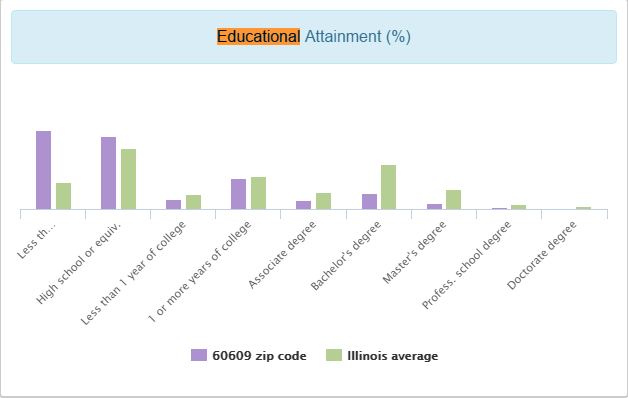
60609:
Racial Makeup Hispanic - 50% Black - 25% Asian - 5% White - 15% Other - 1% Multiple Races -3 % Estimated Median House Value $171,200 Average household size 3.3 people Estimated median household income $33,630 Percentage of family households 60.8% Percentage of residents with income below the poverty level 31.8% Percentage who are foreign-born 26.4% Percentage of residents who live in the same house five years ago 61% Two largest groups, in percentage, of educational attainment Less than high school -> 35. 1% , High School or equivalent -> 32.3% |
|
Works Cited
"60609 Zip Code Detailed Profile."60609 Zip Code (Chicago, Illinois) Profile. Web. 16 May 2016.
"60616 Zip Code Detailed Profile."60616 Zip Code (Chicago, Illinois) Profile. Web. 16 May 2016.
"60653 Zip Code Detailed Profile."60653 Zip Code (Chicago, Illinois) Profile. Web. 16 May 2016.
"Douglas Neighborhood in Chicago, Illinois (IL), 60616, 60653 Detailed Profile." Douglas Neighborhood in Chicago, Illinois (IL), 60616, 60653 Subdivision Profile. Web. 16 May 2016.
